Manage Applicability of Preferred Process for Electrical Redesign (MAPPER)
Background: MAPPER is an electrical design system used to import, and record data for all aerospace wire configuration.
Project Type: Research
Problem: Over the past year, users kept complaining about connectivity errors within the system that prevented or delayed them from completing their tasks.
User Types: Locations A/B based electrical designers
Goal: Wire design team wants UX specialists to investigate all issues faced by the team, gather qualitative and quantitative feedback and present findings to IT director to encourage a tool replacement or remedy.
Time Constraint: 3 month deadline
Process:
Initial meeting to understand project problem and requirements
Kick-Off with stakeholders to present UX plan and process
User access and training to understand the tool in depth
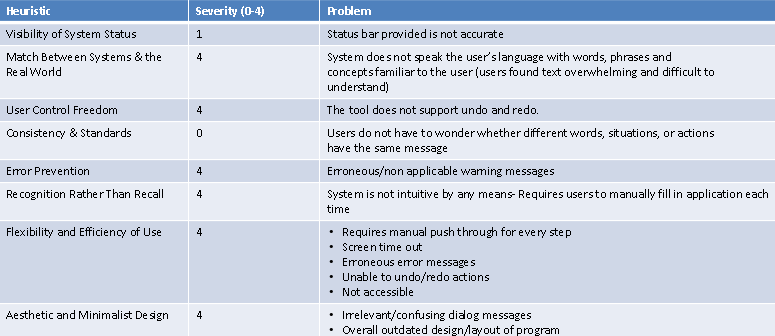
Heuristic Evaluation
Journey map to understand location of user error
User surveys and Interviews conducted
Feedback gathered and presented to obtain user requested changes
(Images and graphs have been left out to abide by proprietary requirements)


Objectives:
•Gather quantitative feedback from both primary roles: wire designers and IT support
•Work with engineers to collect, analyze, and quantify errors and time lost
•List all the pain points in a quantitative matter
•Collect all process inefficiencies
•Bring issues to light on lost time
•Analyze time and productivity loss
Methodology:
Journey Map creation with stakeholders to record system process and error location
User Interviews were conducted with wire design team and IT support team between the West and East coast to understand the differences in errors and pain points faced by users in separate locations.
Fifteen wire designers in both locations were selected to interview
Two IT support specialists in both locations were selected to interview
Participants were semi-randomly selected to ensure population diversity
Virtual and in-lab interviews were conducted
Protocol
Virtual Interviews:
•Sent outlook meeting invitations for interview sessions
•Sessions were 15-30 minutes held over WebEx
•Asked series of interview questions based on research questions and user persona (Designer or IT support)
In-Lab Interviews
•Sent outlook meeting invitations for interview sessions
•Met with users in person to hold 15-30 minute interview sessions
•Asked series of 10-15 interview questions based on research questions and user persona (Designer or IT Support)
User Research Questions
A/B testing and interviews were performed to understand the following errors and how they differed by location.
Main error type encountered
Frequency of Errors encountered
Error location within the tool
Main pain points
IT Support Research Questions
A/B testing and interviews were performed to understand the following errors and how they differed by location.
Frequency of IT support help needed
Number of requests in a day
Main method of contact and process
Connectivity error ticket requests
Non-satisfactory complaints outside of connectivity errors
Process length to complete single user’s request
Calculation of loss of productivity
Quantitative Research Findings
Users in both locations encountered slow connection & erroneous warning messages daily
l location A. users also reported connectivity errors daily (Location B. experienced none)
80% of location A. users reported constant screen timeouts.
50% of location B. users reported constant screen timeouts.
All location A. users stated they experienced one or more errors during every task attempted
50% of location B. users experienced one or more errors during every task attempted
50% of location B. users stated they experienced errors half of the time.
When shown a journey map, all users in both locations also agreed that these errors delayed or prevented them from delivering bundles by their deadlines while waiting for IT support or manually pushing through bundles themselves
All location A. users felt that the tool had constant connectivity errors, was overly time consuming and wasn’t intuitive or user friendly.
50% of location B. users found the tool lacking intuition, was not user friendly and was overly time consuming
Business Benefit
The final result provided qualitative and quantitative proof that users had been dealing with overwhelming connectivity errors and an outdated tool. Both teams were granted a new application that fit UX standards and recommendations I provided to aid in successfully completing their statement of work.